“The ACT government has consistently cut funding for emergency departments despite an increase in demand and complexity, while virtually every other government increased funding to meet the increase in demand and complexity,” writes JON STANHOPE.
WE are all familiar with the regular, one-day-a-year exposure of the fact that, against most measures of timeliness and efficiency, the ACT’s public hospitals invariably report the worst outcomes in Australia in emergency department waiting times and for elective surgery.

To provide some recent context the 2019-20 ACT Health Annual Report advises, at page 64, that the outcome for the strategic indicator “Percentage of emergency department presentations whose length of stay in the emergency department is four hours or less” was 58 per cent against a target of 90 per cent.
In other words, ACT Health missed the target by more than 33 per cent despite the fact that overall presentations over the year had decreased by 6 per cent.
How could ACT Health have got it so wrong?
The answer is fairly clear from just a cursory glance at the latest Productivity Commission Report on Government Services.
What that report reveals is a consistent decline in performance in the ACT when compared to all other Australian jurisdictions.
It is notable, for example, that in 2016-17 the ACT outcome against this measure was 73 per cent compared to a national average of 72 per cent. In comparison to the 14 per cent decline in the ACT to 58 per cent in 2019-20, the national average declined by only 3 per cent to 69 per cent leaving the ACT with the largest decline and the mantle of the worst performing jurisdiction in Australia.
In seeking to explain away this failing, the government is wont to claim an increase in emergency department presentations.
However, the Productivity Commission reports that the increase in presentations in the ACT, in both admitted and non-admitted patients, is below the national average and, in many instances, well below a number of the states so, unfortunately, that explanation does not fly.
For example, the emergency department presentations in the ACT that end in an admission increased by 5.2 per cent annually compared to a national average increase of 6.1 per cent. Interestingly, the increase in Tasmania was 9.3 per cent, Victoria 8.4 per cent and Queensland 7.4 per cent.
 Likewise, the non-admitted patient presentations in the ACT increased at an average of 2.5 per cent a year compared to the national average of 3.5 per cent. The increase in Queensland was 5.4 per cent, SA 4.5 per cent, Victoria 4 per cent and NSW 3.1 per cent.
 Since the increase in presentations in the ACT is below the national average and that of most other jurisdictions in relation to both non-admitted and admitted patients then it is simply not plausible to suggest that either the volume or complexity of those presenting is a factor in the ACT’s Australian worst performance in meeting this nationally agreed measure and strategic indicator.
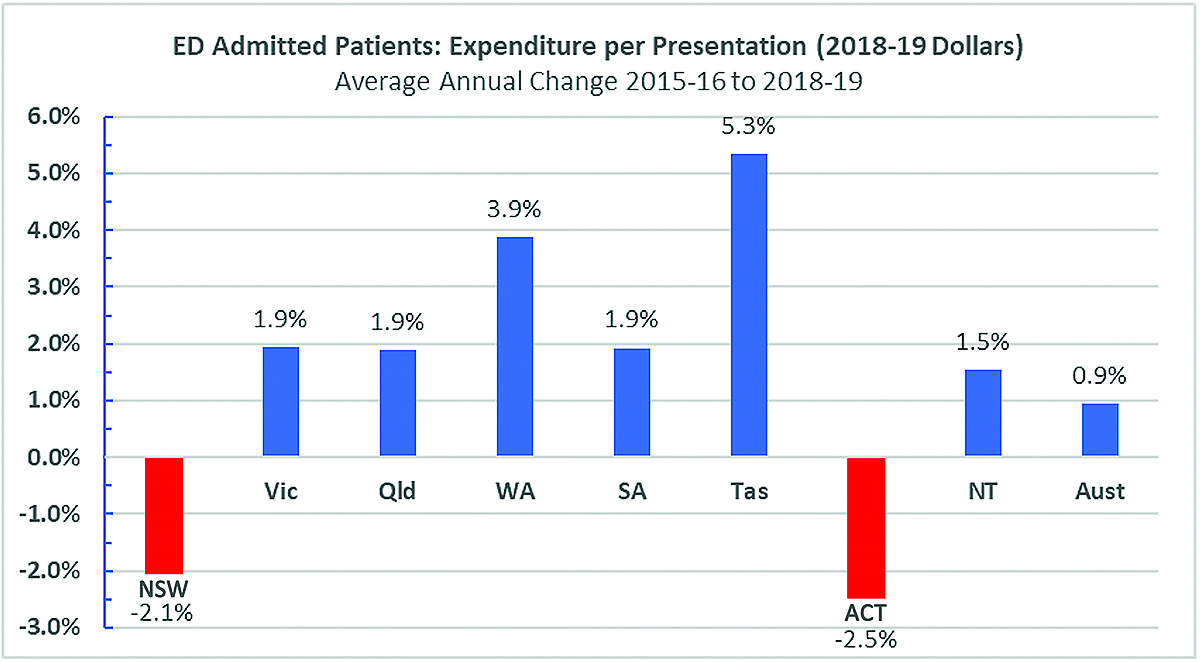
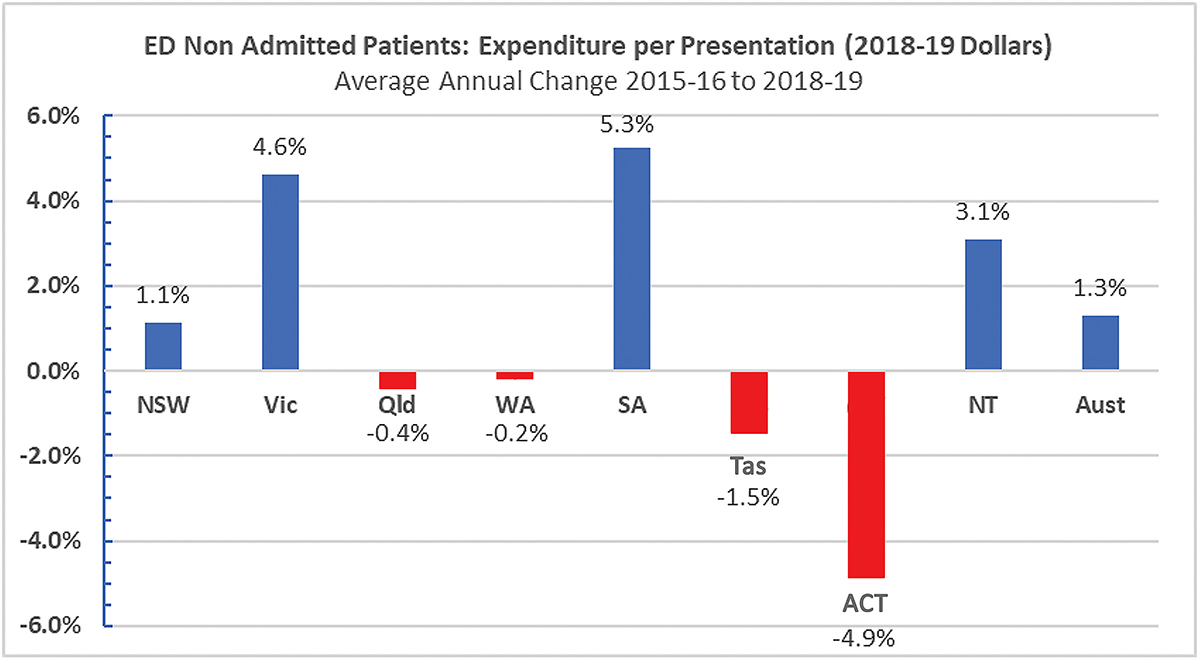
However, the Productivity Commission Report does provide the only plausible explanation for the ACT’s poor performance. Namely, it reveals that the ACT government has consistently cut funding for emergency departments despite an increase in demand and complexity while virtually every other government increased funding to meet the increase in demand and complexity.
The expenditure information published by the Productivity Commission is as revealing as, I think, it is alarming. It shows that over the same period 2015-16 to 2018-19 that non-admitted patient presentations in the ACT increased by 7 per cent (an increase of 2.5 per cent a year on average) expenditure actually decreased by 8 per cent (a decrease of 2.5 per cent a year on average).
Nationally, expenditure increased by 15 per cent over this period. The Productivity Commission analysis shows the ACT to be the only jurisdiction in Australia where there is a significant opposing trend of increasing presentations and decreasing expenditure.
It is notable that compared to the cut in funding suffered by Canberra’s Emergency Departments, expenditure increased in NSW by 13 per cent, Victoria 29 per cent, Queensland 16 per cent, WA 0 per cent, SA 33 per cent, with Tasmania at -2 per cent being the only jurisdiction other than the ACT, in Australia, to cut funding in this vital area of health care need.
For admitted patients, over the period 2015-16 to 2018-19, despite the presentations increasing by 16 per cent, expenditure only increased by 8 per cent, or half the rate of growth in demand.
Over this period, nationally the increase in expenditure on this category of presentations was 23 per cent. Relative to the increase in presentations, the ACT had the lowest increase in expenditure of all jurisdictions.
The published charts, derived from Productivity Commission data, illustrate the very different approach of the ACT government to the funding of healthcare in comparison to the states.
In noting the difference in approach one needs, of course, to acknowledge that it is an approach that the people of Canberra clearly endorsed at the recent election and which ACT Labor and the Greens have a clear mandate to continue. What area of health, I wonder, will be the next to be cut?
Who can be trusted?
In a world of spin and confusion, there’s never been a more important time to support independent journalism in Canberra.
If you trust our work online and want to enforce the power of independent voices, I invite you to make a small contribution.
Every dollar of support is invested back into our journalism to help keep citynews.com.au strong and free.
Thank you,
Ian Meikle, editor


Leave a Reply