“The cavalier approach to the District Projection is consistent with the Barr-Rattenbury government’s approach to urban policy,” writes former planner MIKE QUIRK.
EARLIER this year the government released the “ACT Population Projections 2022 to 2060”.

They were prepared at the ACT and district levels to inform strategic, infrastructure and services planning and were based on expectations about fertility, mortality and migration.
By influencing when and where infrastructure is provided, they affect the wellbeing of the community. As identified by the Treasury, they are indicative and should be used cautiously. They are susceptible to social and economic change and unforeseen events, as the recent pandemic highlights.
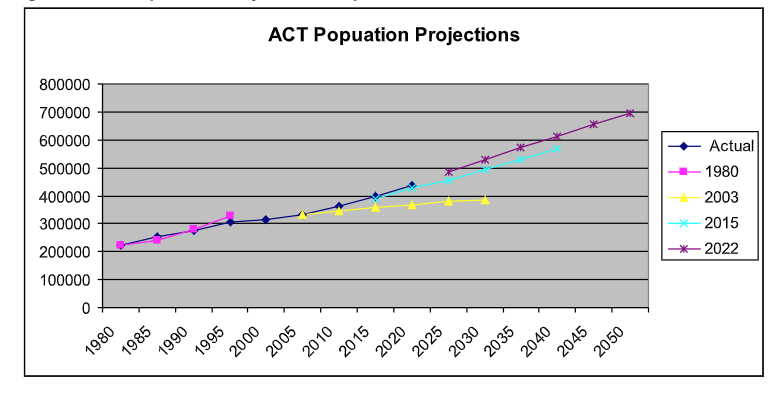
Comparing past projections with actual population growth demonstrates the risk. The 2003 projection, prepared at a time of low growth expectations, projected the 2021 population of Canberra to be 370,700.The 2021 population of Canberra was 453,600. Figure 1 compares several past projections.
Figure 1: ACT Population Projection Comparison
 The low-growth expectations contributed to the decision to close schools. If the high-growth future in the 2022 ACT Projection (it projects a 2060 population of 784,000) is not realised, there could be an unnecessary and wasteful provision of infrastructure.
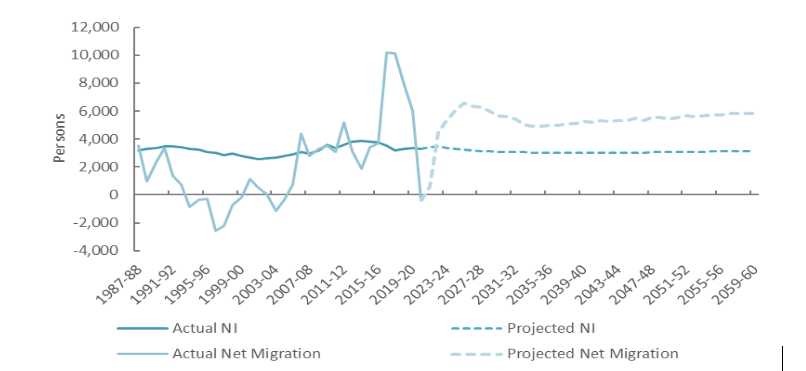
Figure 2 shows past population growth and that projected in the 2022 projection. It demonstrates the volatility in net migration.
Figure 2: Population growth by component: historical and projections, 1987-88 to 2059-60

The level of future migration to the ACT will be strongly influenced by the level of overseas migration. Nationally, net overseas migration (NOM) is expected to be a historically high 1.5 million over the next five years, predominantly from the return of international students and an increase in skilled migration to overcome labour shortages.
The increase will exacerbate the major undersupply of housing and infrastructure. A substantial reduction in NOM to address these problems would lower migration to the ACT, which could also be reduced by an increase in remote working, high housing costs and an undersupply of detached blocks.
Fertility levels also influence population growth. The 2022 Projection assumes the TFR (total fertility rate – the average number of children a woman would have over her childbearing years based on current birth trends) will fall from 1.6 in 2019/20 to 1.5 by 2030.
Fertility rates could be considerably lower if trends in some European (Italy, 1.25, Portugal, 1.23, Spain, 1.19) and Asian (South Korea, 0.81 and Japan, 1.3) countries eventuate.
The decline could reflect women deciding to avoid the lifetime loss of earnings typically experienced by women with children. High housing costs could also reduce future fertility.
Lower migration and lower fertility would affect the age structure of the population, will impact on infrastructure programs and increase the dependency ratio (the number of non-working age persons in a community dependent on working age persons). The uncertainty highlights the need for caution, flexibility and regular review of projections.
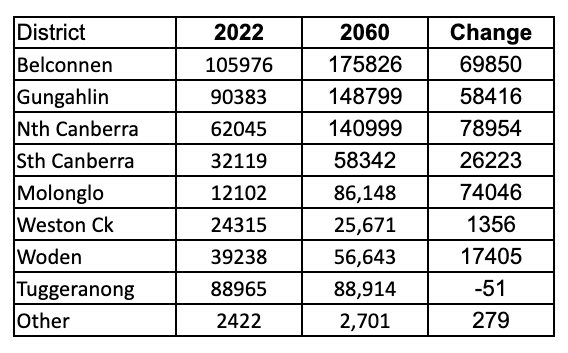
While the assumptions behind the ACT Projection are defensible, the same cannot be said for the District Projection, which projects all of Canberra’s population growth between 2022 and 2060 will be accommodated in the existing Districts (see Table 1).
Table 1: Projected Population by District 2022 to 2060

The underlying assumptions have not been stated and it has been prepared without assessment of the infrastructure, housing choice, housing affordability, travel and environmental costs and benefits of alternative population and employment distributions.
What are the redevelopment, land release, inter-suburb migration and housing choice assumptions behind the large population increases projected in Molonglo, Gungahlin, Belconnen, North and South Canberra?
How is the limited growth projected for Tuggeranong and Weston Creek consistent with the modest increases in population currently occurring within these areas? Why was it assumed that no additional greenfield area would be developed?
How the District Projection assists in the delivery of good outcomes is hard to fathom. It does not have a sound empirical base as reasonable information of where dwellings are likely to be occupied is only available for around seven years.
Unless the government believes the analysis of alternative urban futures is unnecessary and decisions should be based on untested opinion, the District Projection beyond 2029 should be withdrawn to allow the necessary assessments to be undertaken.
The cavalier approach to the District Projection is consistent with the Barr-Rattenbury government’s approach to urban policy.
While its strategy of increasing population along major transport corridors and at centres is sound, its implementation has been deeply flawed.
It has mismanaged redevelopment (where is the gentle urbanism?), not considered housing preferences, has undersupplied detached dwellings, failed to investigate possible greenfield settlement areas or supply sufficient social housing.
Its development of light rail has not been supported by evidence and it has failed to evaluate potentially more cost effective and, possibly more sustainable, bus-based solutions.
Similar inadequacies are apparent in health and education policy.
Despite widespread concern, the government’s response to criticism is obfuscation, spin or silence.
Will the community’s tolerance of the government’s opaqueness and evidence-free decision making continue at the next election?
Mike Quirk is a former NCDC and ACT government planner.
Who can be trusted?
In a world of spin and confusion, there’s never been a more important time to support independent journalism in Canberra.
If you trust our work online and want to enforce the power of independent voices, I invite you to make a small contribution.
Every dollar of support is invested back into our journalism to help keep citynews.com.au strong and free.
Thank you,
Ian Meikle, editor


Leave a Reply