“The ACT government has clearly decided that enhanced growth in health costs is unaffordable and has therefore ceased funding for population growth and ageing et al.” JON STANHOPE and Dr KHALID AHMED continue to analyse the state of Canberra’s public health system – this time, waiting times.
AS we noted here, the latest Productivity Commission report reveals that from 2015-16 to 2018-19, the ACT government, under the leadership of Andrew Barr and Shane Rattenbury, reduced health funding by 10.3 per cent in real terms over three years during which time activity increased by 9.7 per cent.
And, no, this does not reflect an improvement in efficiency or “doing more with less”.
Obviously, all governments face competing challenges in managing their finances. There is, for example, pressure to keep taxes as low as possible to encourage consumer spending and business investment which, in turn, support job creation and the economy.
On the other hand, essential community services must be funded. The increasing costs of healthcare are a particular challenge, where the combined effects of population growth, ageing, technology improvements and inflation require a funding growth rate that is more than “normal” revenue growth.
However, the ACT government has clearly decided that such enhanced growth in health costs is unaffordable and has therefore ceased funding for population growth and ageing et al.
It is notable that in the period 2009-10 to 2011-12, the ACT not only posted operating Budget surpluses but provided for health funding growth of 6.4 per cent per annum through its annual Budget.
We are, of course, mindful of the need to pursue improvements in efficiency when managing public finances. However, the current government’s approach to health funding is one of budget constraint and the rationing of services, rather than one that seeks to involve clinicians and other health professionals to develop an appropriate clinical governance model centred on the efficient and effective use of resources.
If efficiencies had been achieved, they would be reflected in a stable or enhanced operating performance and a reduction in unit costs.
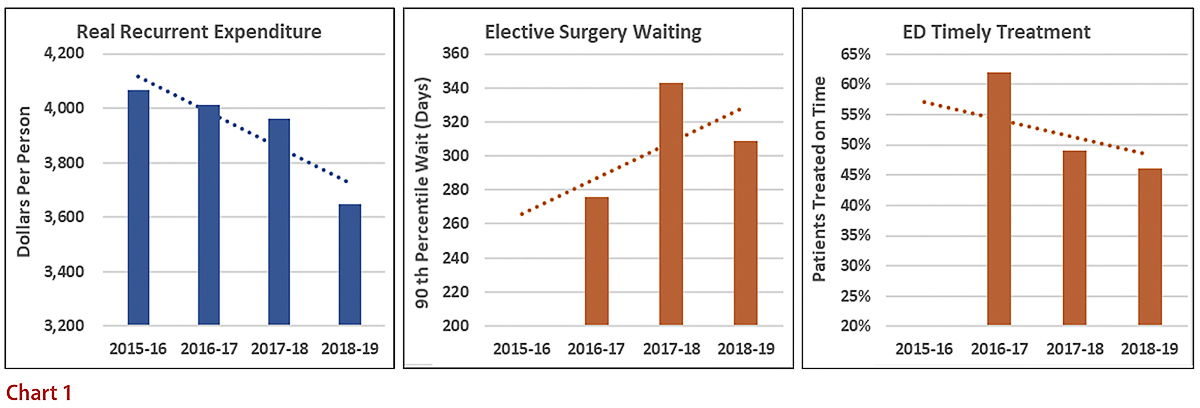
However, the Productivity Commission data highlights a clear connection between the cuts made by the Barr/Rattenbury government to health funding and a dramatic deterioration in performance and outcomes (Chart 1).

In 2014-15, the 90th percentile wait time for elective surgery in the ACT was 246 days compared to the national average of 265 days. By 2017-18, wait times had blown out by more than one third to 343 days while the national average was effectively stable at 270 days. As noted previously, the proportion of patients treated within the nationally agreed benchmark declined to a mere 46 per cent. We have only looked at performance up to 2018-19 to exclude the pandemic effects.
There are numerous clinical studies highlighting the adverse effects of delayed surgery, which include clinical complications, longer hospital stays and unplanned readmissions. In addition to the pain and suffering for individuals dependent on the public hospital system and faced with inordinate wait times for care, there are financial costs related to the additional hospital resources required, as well as economic costs resulting from lost productivity.
A significant “cost”, which we fear is increasingly overlooked, is the inequities that result from a blanket cut to health funding – ie, who in Canberra is impacted and suffers the most because of a reduction in public health services? The Productivity Commission data provides some insight into that question.
The Index of Relative Socio-Economic Disadvantage (IRSD) published by the ABS is an area-based, broad measure of disadvantage. A low score reflects more households with low incomes, people with no qualifications and people in low-skilled occupations. A higher score reflects fewer households and people in those categories, and quintile one reflects the most disadvantage while quintile five reflects the least disadvantage.
The Productivity Commission reports the proportion of people treated within benchmark times in emergency departments by IRSD Quintiles as well as by indigenous status.

However, the outcomes for one disadvantaged group, namely Aboriginal and Torres Strait Islander peoples, is not equitable. Only 43 per cent of indigenous people received timely treatment compared to 46 per cent of non-indigenous people, and 48 per cent for IRSD Quintile 1. The timeliness of treatment does not change with relative disadvantage. In fact, people from IRSD Quintile 1 (most disadvantaged) received timely treatment at a slightly higher rate compared to those from IRSD Quintile 5 (least disadvantaged), ie, 48 per cent compared to 47 per cent respectively. This is as one would expect of an equitable system.
We note there are, annually, more than 140,000 presentations in the ACT’s emergency departments, with more than 5000 of these being people identifying as Aboriginal. The difference between Aboriginal and non-Aboriginal people’s rates of timely treatment in our hospitals should be of grave concern to all of us.
According to the Productivity Commission’s report, Aboriginal Canberrans are 60 per cent more likely not to wait in emergency departments; are two and a half times more likely to leave at their own risk; and 4.7 times more likely to leave or discharge themselves against medical advice, compared to other Canberrans.
We are unaware of any attempt at explaining this greater propensity among Aboriginal Canberrans to leave hospital without treatment, and against medical advice. However, it could reasonably be attributed to relatively longer wait times and lower confidence in the system.
Elective surgery wait times for Aboriginal and non-Aboriginal people living in Canberra paint a similarly disturbing picture.

Doubly concerning is that the difference between Aboriginal and non-Aboriginal Canberrans’ wait times is worsening.
For example, in 2016-17, the 90th percentile wait period for Aboriginal people was 286 days, while for other Canberrans it was 276 days. In 2018-19, wait times increased to 371 days and 307 days, respectively.
The reason for the disparity in wait times identified by the Productivity Commission is not clear. From the available data, we note that once admitted, quality of care and patient safety are the same for Aboriginal and non-Aboriginal peoples.
However, inequity in access, as illustrated by the Productivity Commission, is a hallmark of a resource-constrained system. A ready example of this phenomenon is the difference in wait period between public and private hospitals.
Nevertheless, for the self-declared most progressive government in Australia, these disparities in access should be embarrassing. It seems to us that the ACT government has traded-off equity in favour of so-called efficiency in the apparent belief that such a trade-off is ethically acceptable to the Canberra community.
Who can be trusted?
In a world of spin and confusion, there’s never been a more important time to support independent journalism in Canberra.
If you trust our work online and want to enforce the power of independent voices, I invite you to make a small contribution.
Every dollar of support is invested back into our journalism to help keep citynews.com.au strong and free.
Thank you,
Ian Meikle, editor


Leave a Reply