
How much does the ACT government care about your health? Spoiler alert: not much given this shocking analysis of hospital funding by JON STANHOPE and DR KHALID AHMED who chart the devastating effects of Andrew Barr and Shane Rattenbury’s siphoning of hundreds of millions of health dollars to fund public transport.
IN what has become a regular occurrence, a recent report, this time from the Productivity Commission, confirmed yet again the ACT’s position as the worst performing jurisdiction in Australia in providing timely treatment in hospital emergency departments.
Waiting times for a range of elective surgery are also the worst, and overall, below the national average. We acknowledge, of course, that the ACT’s appalling record in delivering health services would be far worse if not for the dedication and professionalism of our frontline health workers.
A major concern about the continuing deterioration in ACT health services is not only that it is no accident, but that the community appears to have been so desensitised that our sub-par performance is now not only expected, it is accepted by many in the community. We note, for example, that there has been no meaningful commentary or analysis in the mainstream media of the Productivity Commission report on healthcare to which we refer.
For the record, Table A provides a comparison of the ACT’s performance with other jurisdictions in treating patients in emergency departments within clinically appropriate times.
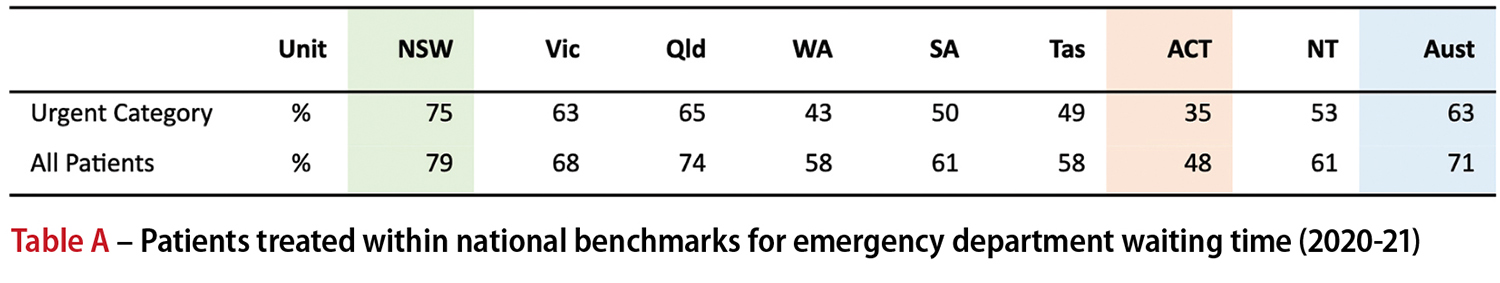
It is particularly concerning that only 35 per cent of “urgent” patients presenting in the ACT are treated within the clinically appropriate time. The national rate is 63 per cent and NSW achieves a rate of 75 per cent. In recent years, when asked about the ACT’s poor performance, Health Minister Rachel Stephen-Smith has insisted that patients presenting in the ACT have greater complexity, and/or that the emergency departments are clogged up by people who should not be there, but should have attended a walk-in centre or seen a GP.
In other words, if only sick people would stop going to the hospital the problem would be solved.
With respect, the two explanations cannot both be true, as either the ACT has proportionately more patients in triage categories requiring urgent treatment, in which case there would be relatively fewer patients in semi or non-urgent categories, or vice versa. In fact, neither of the Minister’s excuses are valid as evidenced by the Productivity Commission data.
In the ACT, 1 per cent of patients presenting required Resuscitation, the most urgent category, which is the same as every other jurisdiction. In 2020-21, 12 per cent of ACT patients were triaged in the Emergency category (Category 2), the lowest rate nationally along with Tasmania, while the national average was 14 per cent. The proportion triaged in the Urgent category (Category 3) was 41 per cent, which was higher than the national average of 37 per cent, but on par with Queensland and SA. Across all jurisdictions, Category 1 to 3 presentations ranged between 48 per cent and 56 per cent of all presentations. In the ACT, this proportion was 54 per cent.
Therefore, it is not true to claim that there are relatively more high-priority cases presenting in the ACT’s emergency departments than in other jurisdictions.
The converse applies for the proportion in Categories 4 and 5 presentations, which range between 44 per cent and 52 per cent across the nation, with 46 per cent in the ACT. In fact, NSW with 13 per cent Category 5 (Non-urgent) presentations, the highest in the country, could presumably claim that that influences its ability to treat patients within the benchmark times.
Yet NSW has the best times, as evident in the table above. In the ACT, non-urgent presentations constituted 7 per cent of the total, confirming there is no basis for asserting that non-urgent presentations are to blame for the ACT’s poor performance.
The truth of the matter is that the hospital redevelopment plan developed under the guidance of the then Health Minister Katy Gallagher and endorsed by the then government in 2011 was abandoned when Ms Gallagher left the Assembly for the Senate in 2014.
The planned increase in bed capacity, which was only one component of the redevelopment project, was repeatedly deferred by incoming Chief Minister Andrew Barr and Greens leader Shane Rattenbury in favour of investment in public transport.
The hospital redevelopment currently underway is on a vastly reduced scale to that initially proposed by Katy Gallagher and will clearly not meet demand. Access block currently being experienced, and which we are confident will continue well beyond 2024, can be directly attributed to the withdrawal of capital funding for the redevelopment of the Canberra Hospital precinct.
We have on several occasions since 2016, noted that the annual funding growth provided in ACT Budget forecasts was not sufficient to meet the costs of inflation and population growth or the increase in demand from ageing, and improvements in technology.
We have, in fact, shown quite clearly that once these drivers of demand and costs are considered, there has in each year since 2015-16 been a large reduction in operating funding for health services in the ACT, in real terms.
We note, with due modesty, that the latest Productivity Commission data on actual expenditure on public hospitals across Australia confirms everything we have said about cuts to the ACT health budget.
Table B provides a comparison of changes in expenditure per person from 2015-16 to 2018-19. We have not included data for 2019-20 as it includes emergency response funding for COVID-19, which varies across jurisdictions.

The table highlights an annual average cut in real terms expenditure per person in the ACT (ie, allowing for population growth and inflation) at the rate of 3.6 per cent while activity increased by 3.1 per cent per annum. WA is the only other jurisdiction that had a decrease in real per person expenditure, however, it also had an annual average decrease in hospital separations.
We estimate that if the ACT government had simply maintained per person expenditure at the 2015-16 level in real terms, public hospital services in the ACT would have received about $175 million in additional funding in 2018-19. If expenditure had grown at the national average rate, the additional funding, in that year, would have been in the order of $238 million.
In similar vein if the hospital redevelopment plan sponsored by Katy Gallagher and endorsed by Cabinet in 2011 had not been abandoned by the Barr/Rattenbury government there would by 2018-19 have been an additional 132 public hospital beds in Canberra funded by the $175 million that was diverted to other uses.
However, as a direct consequence of the funding cuts in real terms, and withdrawal of capital investment, the proportion of patients treated in the ACT within the national benchmarks decreased from 62 per cent in 2016-17 to 46 per cent in 2018-19.
The government might seek to argue in its defence that the territory’s health system has become more “efficient” in delivering services as it has been able to manage an increase in activity while curtailing expenditure growth. However, there is a significant cost to any such claimed “efficiency”, which is not just in increased waiting times. We will discuss this in a subsequent article.
Who can be trusted?
In a world of spin and confusion, there’s never been a more important time to support independent journalism in Canberra.
If you trust our work online and want to enforce the power of independent voices, I invite you to make a small contribution.
Every dollar of support is invested back into our journalism to help keep citynews.com.au strong and free.
Thank you,
Ian Meikle, editor


Leave a Reply