
“The ACT has dropped from one of the top performing jurisdictions in Australia to the worst.” JON STANHOPE & KHALID AHMED find little comfort and lots of debt in the ACT Treasury’s Pre Election Budget Update.
The ACT Treasury has a very important role in the electoral process and the functioning of our democracy.
The under treasurer is required to prepare a pre-election budget update at least 30 days before the election as a Notifiable Instrument (Section 20C of the Financial Management Act 1996 details what must be included in the update).
The purpose of the pre-election budget update is set out in Section 20D of the FMA as follows:
- to allow the assessment of the government’s financial performance against the financial policy objectives and strategies set out in the latest financial policy objectives and strategies statement; and
- to give the electorate an accurate picture of the territory’s financial position before the election.
The ACT Pre Election Budget Update (PEBU) was released on September 18.
The updated financial statements reflect some movements from those published in the 2024-25 Budget in June. While we do not propose to discuss those changes in detail, we note that the forecast Net Operating Balance for 2024-25 has deteriorated from a deficit of $855 million in the Budget to $872 million in the PEBU. However, there has been a miraculous recovery in the operating position of $788 million over the forward estimates period. The overall financial position nevertheless remains unchanged.
The update is useful in providing information on the provisions (where funding has not been allocated to agency budgets) for capital, expense and revenues, and the various policies and strategies that have been announced but not funded in the budget. Such provisions are not disclosed in the normal budget papers.
Provisions for capital expenditure total $1.251 billion over the three years from 2025-26 to 2027-28. The most notable provisions are, $60.9 million for public housing, $50 million for Light Rail Stage 2B, and $675.9 million in other provisions for as yet unidentified projects. Any future large-scale projects will need to be financed within these provisions or through additional debt.
Expense provisions total $1.180 billion over the three forward years. Again, these are expenses that are included in the aggregate expenditure estimates but have not been allocated to agencies, and include $142.5 million for the Digital Health Strategy, $170.6 million for current and future EBA negotiations, $48.75 million for the territory’s contribution to the National Disability Insurance Scheme, and savings of $1.147 million against a curiously titled item “More frontline paramedic”. How “more” paramedics would cost less has not been explained.
Surprisingly, the provisions do not include any funding for the 800 additional health workers promised by the government in a flurry of flyers to all Canberra households.
The PEBU identifies several plans and strategies across government that are not included in full or in part and will be subject to future government budgetary decisions.
Items not included are: ACT Climate Change Strategy 2019-25; ACT Disability Strategy 2024-2033; ACT Infrastructure Plan update; ACT Sustainable Buildings Pathway; ACT Transport Strategy 2020; ACT’s Zero Emissions Vehicles Strategy 2022-30; Canberra Hospital Master Plan 2021-2041; Disability Justice Strategy: Second Action Plan 2024-2028; District Strategies; Electronic Monitoring Implementation Strategy; Insourcing Framework; Integrated Energy Plan 2024-2030; National Firearms Register; Urban Forest Strategy 2021-2045.
The Treasury also advises that the estimates in this PEBU reflect current government policy, including decisions made since the 2024-25 Budget, and that the estimates do not pre-empt decisions that may be made by a future government.
We have previously pointed out that the government’s budget estimates have consistently understated expenditure and that they do not reflect the true cost of services into the future.
With virtually no change in the PEBU from the June budget estimates, we maintain the view that the forward estimates do not reflect the cost of current policy.
For example, it is certain that the government will not be able to meet the nationally agreed performance targets in health with the funding allocated.
Further, the financial information provided in the PEBU has limited value in assisting in an assessment of the ACT’s financial position.
In principle, it should answer three questions: what does it mean, where do we stand, and where have we come from?
For example, the forecast of $12.393 billion in Net Debt in 2028 is only meaningful if considered in the context of forecast revenue thus allowing an assessment of the debt’s serviceability, ie, Net Debt to Revenue Ratio, which in fact is used by the rating agencies for that purpose.
A comparison across jurisdictions of this measure allows for an assessment of whether the ACT’s debt is at par with others or abnormal and of any change or trend over time.
Regrettably no such information is provided in the 2024 PEBU. By way of comparison the 2012 PEBU, for example, provided key relevant metrics, and a comparison across jurisdictions.
Financial scorecard
The illustrated charts offer a comparison of key metrics across all Australian jurisdictions, as well as historically.
Chart 1 reflects the Net Operating Balance (surplus or deficit) as a proportion of expenses, a standard measure of the operating budget for ACT (PEBU) and the weighted average of all states and the NT.
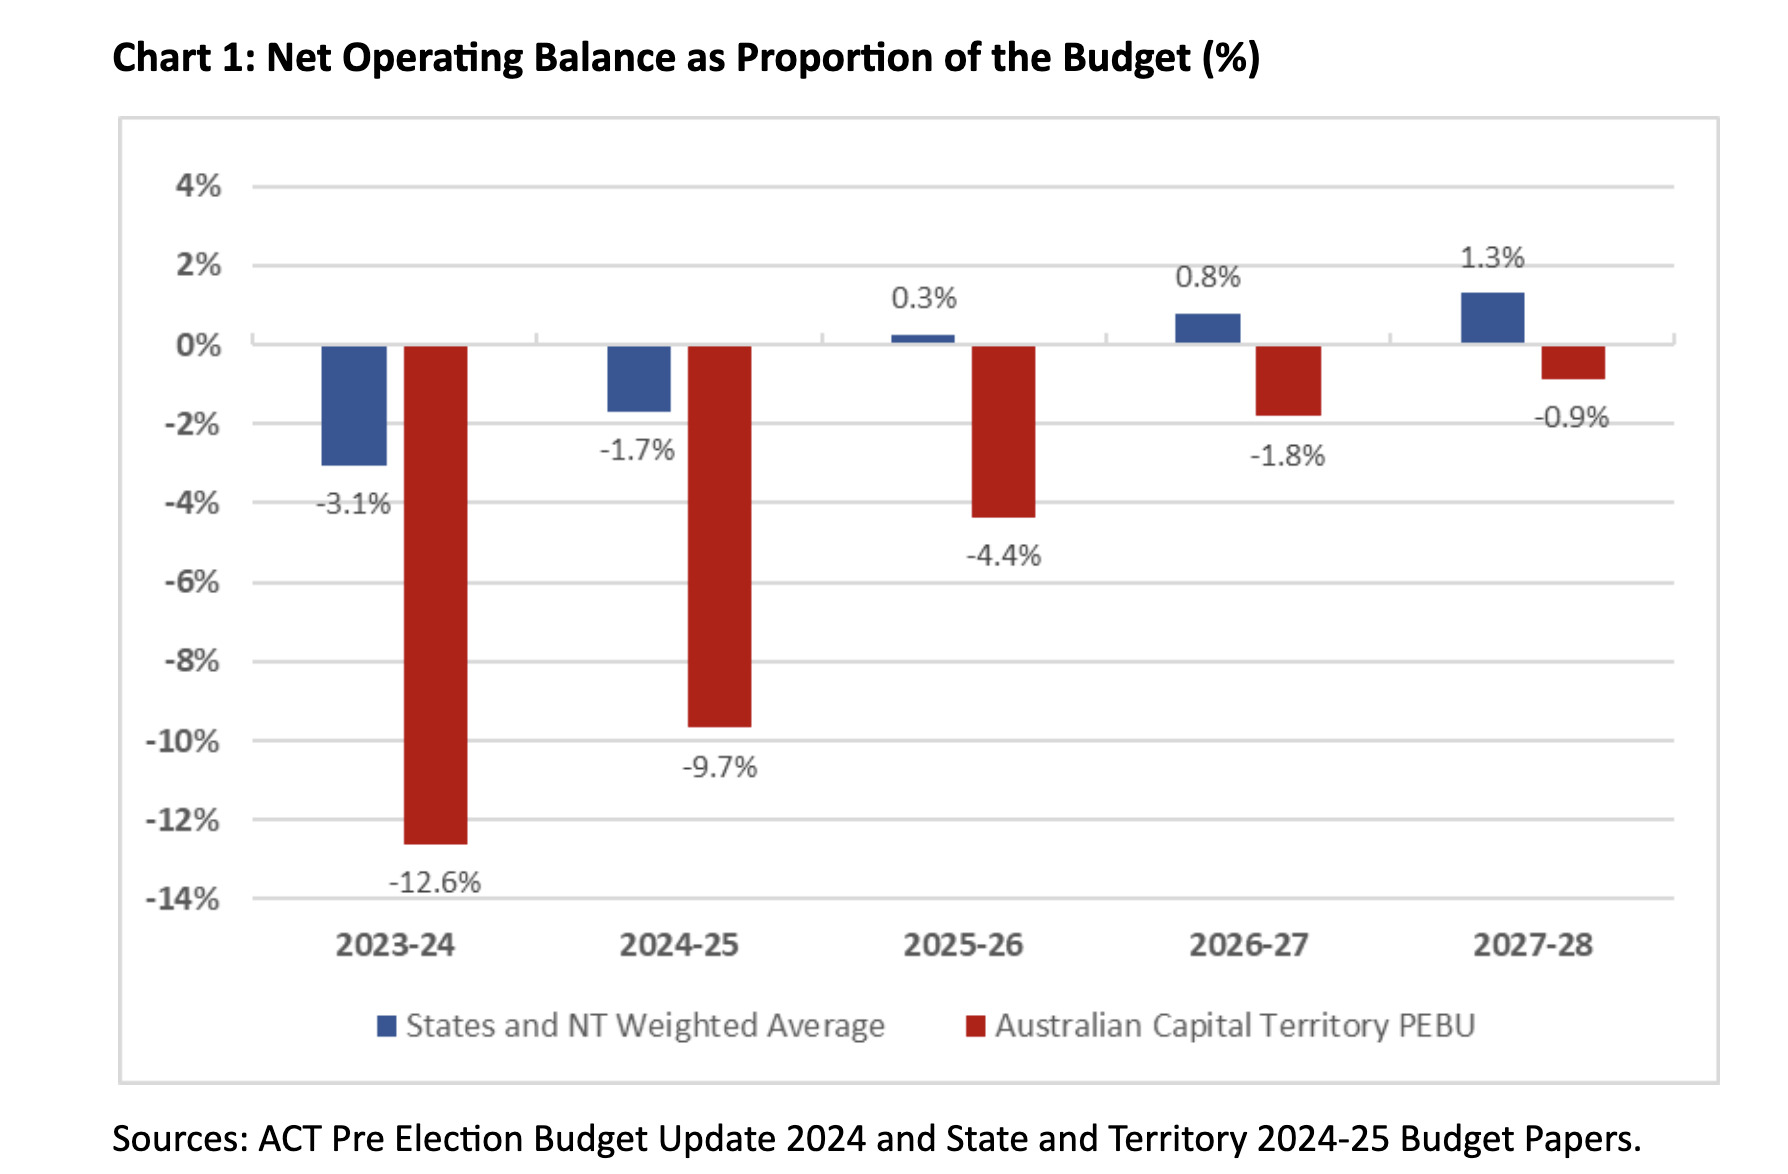
The ACT’s deficits are significantly larger by comparison when other jurisdictions are also in deficit, and the territory’s operating budget is forecast to remain in deficit while other jurisdictions return to surplus in aggregate in 2025-26.
Chart 2 reflects the Net Debt to Revenue ratio, a standard measure of the debt serviceability for ACT (PEBU) and the weighted average of all states and the NT.
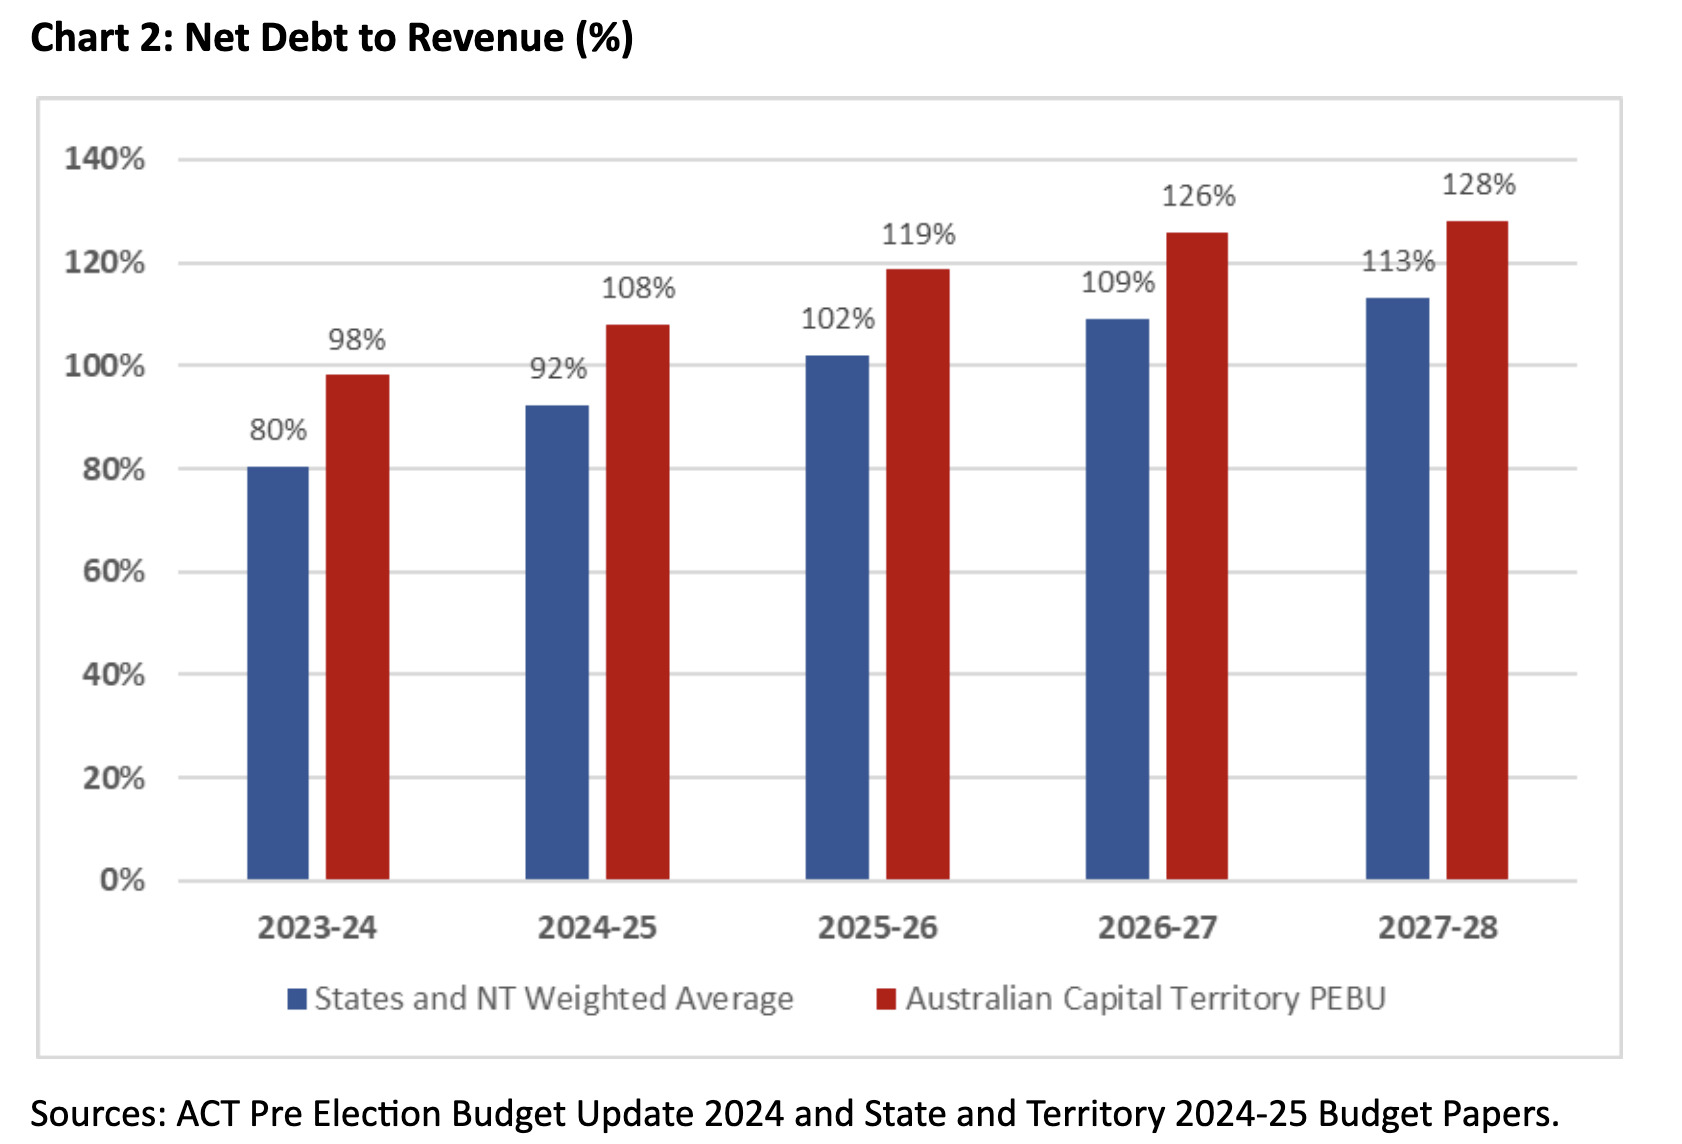
The PEBU forecasts ACT’s Net Debt to Revenue ratio to increase to 128 per cent in 2028, the second highest of all jurisdictions behind Victoria and well above the national average.
So, where have we come from, and what has occurred since the Labor-Greens coalition has been in government in the ACT? Table 1 summarises the changes in key metrics.
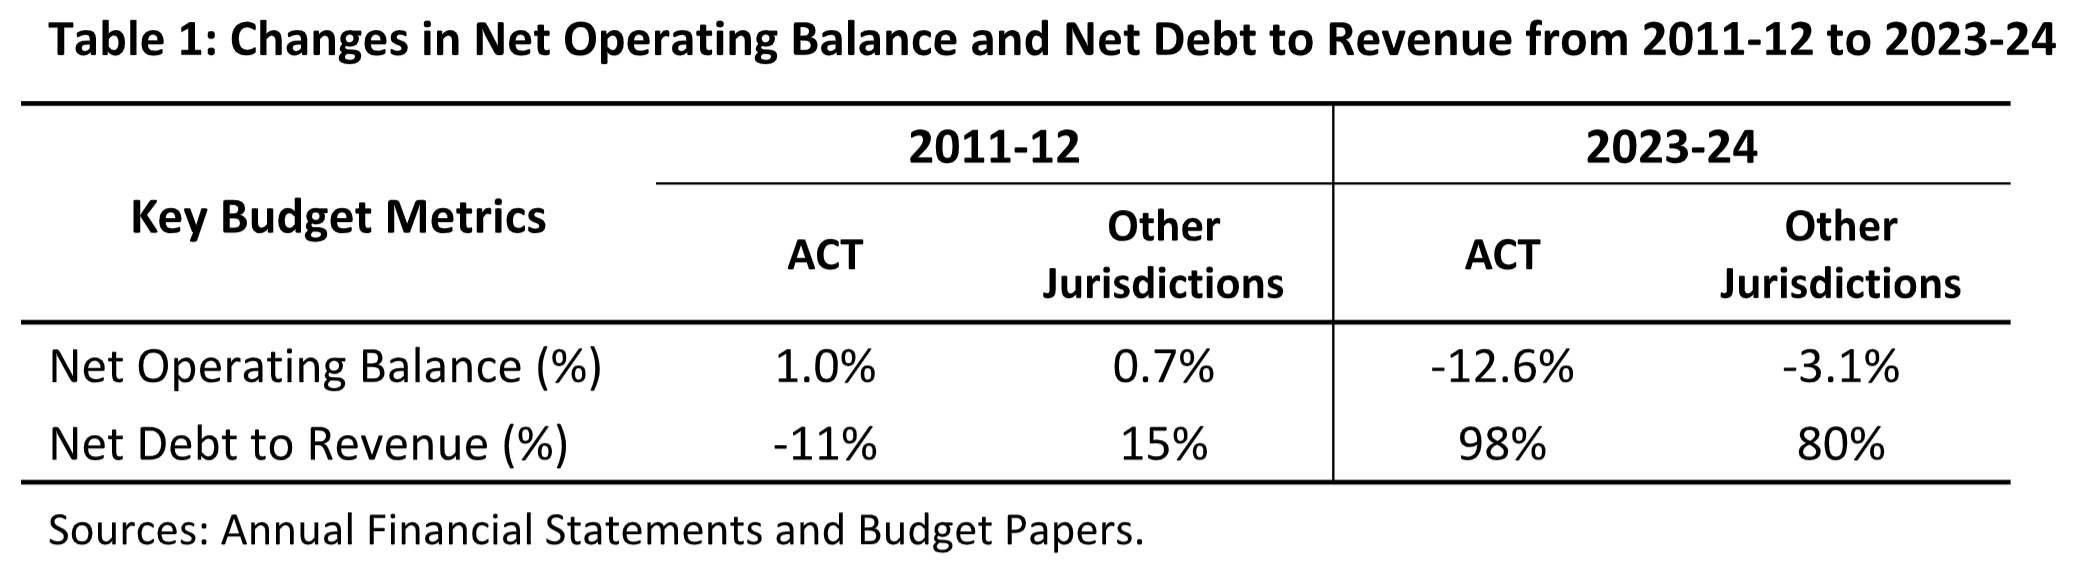
In effect the ACT has dropped from one of the top performing jurisdictions in Australia to the worst.
With regards to an assessment of the government’s financial performance against the financial policy objectives (as set out in Section 20D of the FMA), one can only conclude that if the objective was to increase debt to 128 per cent of revenue after a rating downgrade at 98 per cent, and the operating budget to be relegated to a worse position than the average of all other Australian jurisdictions, then according to PEBU, those objectives will quite clearly be met!
Jon Stanhope is a former chief minister of the ACT and Dr Khalid Ahmed a former senior ACT Treasury official.
Who can be trusted?
In a world of spin and confusion, there’s never been a more important time to support independent journalism in Canberra.
If you trust our work online and want to enforce the power of independent voices, I invite you to make a small contribution.
Every dollar of support is invested back into our journalism to help keep citynews.com.au strong and free.
Thank you,
Ian Meikle, editor


Leave a Reply