“The ACT stands out from the rest of Australia on two counts: the extent of its deficit and the persistence of its deficit across the forward estimates and beyond”. In the second of a two-part critical analysis of the October 6 ACT Budget, JON STANHOPE and Dr KHALID AHMED discover that beyond the unsustainability of the growth in the ACT’s debt, there are serious intergenerational equity considerations in play.
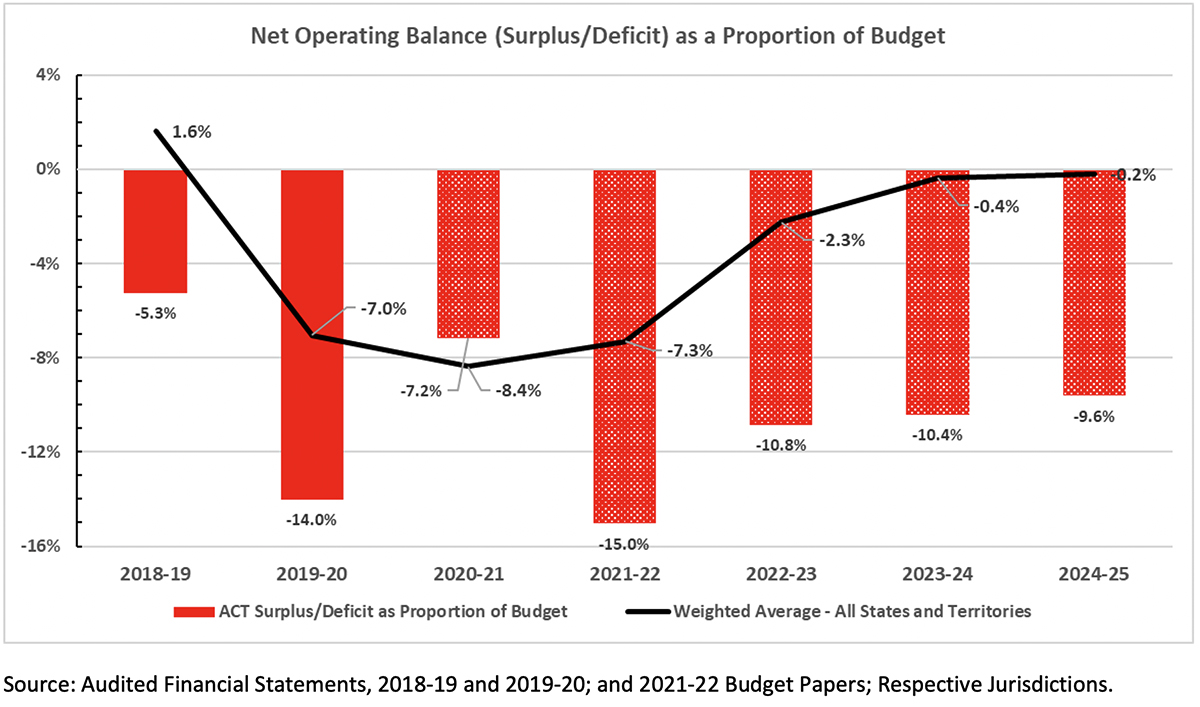 CHART 1
IN an article last week in which we reviewed the ACT 2021-22 Budget, we pointed out that the forecast deficit was 15 per cent of the operating budget, the highest in Australia.
We concluded, based on our analysis of the Budget position, operating deficit and debt that the territory’s Budget does not have the capacity to invest, or spend, towards recovery.
We believe this is reflected in the Budget allocations. Rather than “turbo-charging” the economy in the next three quarters or the next year through infrastructure investment, the current Budget allocations reveal, in fact, a reduction in the cash (capital) commitments compared to the previous Budget.
On the recurrent side, while the Budget returns some of the previously withheld growth funding to health, to prepare the system to respond to the likely increase in covid-induced pressures, there are no other notable increases in expenditure.
The COVID-19 pandemic has impacted state and territory budgets to varying degrees. Such impacts have been revenue-side decreases and expenditure-side increases relative to the extent of lockdowns. Consequently, all jurisdictions (except WA) have forecast deficits for 2021-22, and a return to a balanced or surplus budget position in two to three years.
Notably, the ACT stands out from the rest of Australia on two counts: (a) the extent of its deficit, and (b) the persistence of its deficit across the forward estimates and almost certainly well beyond that.
As illustrated in CHART 1, in the base year 2018-19, before the pandemic, the ACT had a deficit of 5.3 per cent of its spending budget, whereas the weighted average for all states and territories was a surplus of 1.6 per cent.
In the following year, 2019-20, the pandemic’s part-year effect (from March 2020 to June 2020) is reflected in a weighted average deficit of 7 per cent while the ACT’s deficit, as reported in its audited financial statements, grew to 14 per cent, which is double the national average. For 2021-22 (the current Budget year), the ACT’s forecast deficit is 15 per cent, which is, once again, more than double the national average of 7.3 per cent.
Over the forward estimates period to 2024-25, the states and territories as a whole return to close to a balanced position (weighted average deficit of 0.2 per cent), with a number of jurisdictions even returning to a surplus position, for example, NSW (0.5 per cent), Queensland (0.2 per cent), and of the smaller jurisdictions, Tasmania (1.6 per cent), and SA (2.1 per cent a year earlier in 2023-24).
However, the ACT government has forecast ongoing deficits beyond the Budget averaging more than 10 per cent. Even on its preferred and less rigorous headline measure, across the forward estimates, the ACT government will be in deficits averaging 7 per cent of the Budget.
In addition to the unsustainability of the growth in the ACT’s debt, there are serious intergenerational equity considerations in play.
Significantly, the Financial Management Act requires the government to have regard to the principles of responsible fiscal management and intergenerational equity in preparing its annual Budget.
While the Act allows for a proposed Budget to depart from the principle of responsible fiscal management, the departure must be temporary, and the Treasurer must present to the Legislative Assembly a statement setting out a return path to the principles of responsible fiscal management.
An airy promise to one day return to a balanced budget will not meet that legislative requirement.
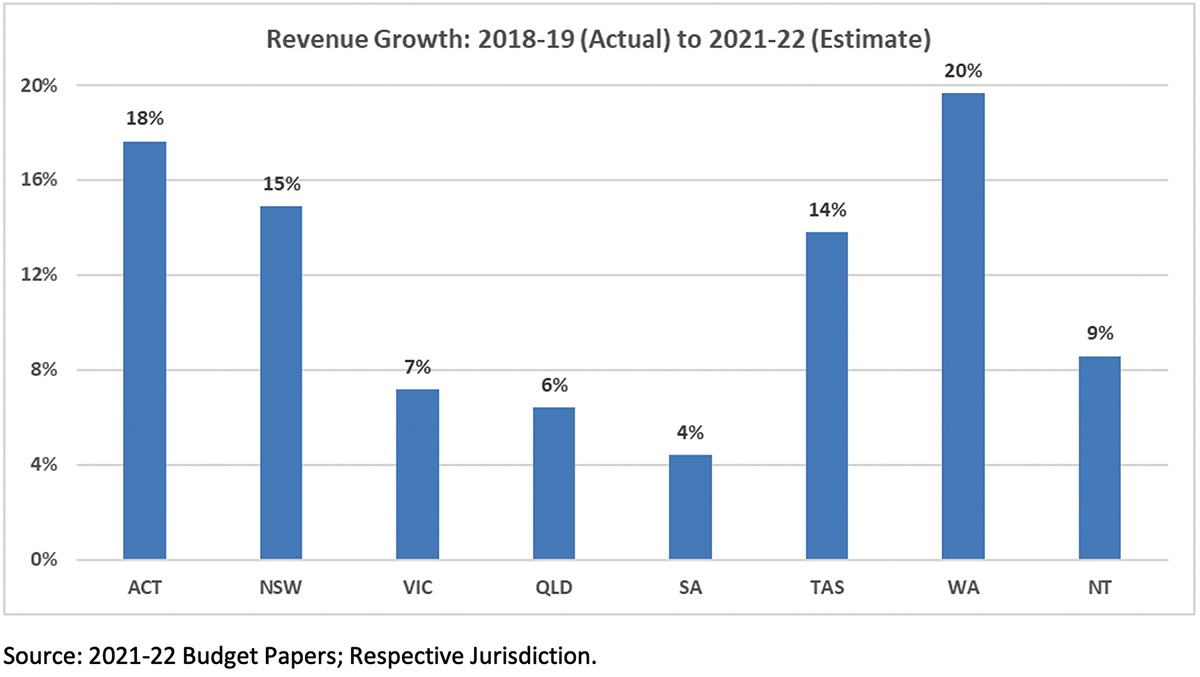 CHART 2
Revenue’s up, but so’s the deficit
IT is difficult to attribute the ACT’s relatively deeper deficit (in fact, the largest in Australia) to a relatively greater revenue impact from COVID-19.
In fact, as CHART 2 illustrates, the ACT’s revenue increase of 18 per cent from 2018-19 to the 2021-22 Budget is second only to WA (20 per cent) and would be the envy of all other Treasurers, notably those of SA, Queensland and Victoria.
Total revenue is estimated to increase, in the ACT, by 12.5 per cent in 2020-21, and a further 4.6 per cent in 2021-22. Taxation revenue is forecast to increase by 8.5 per cent in the Budget year and at a compounding average of 5.4 per cent per annum over the forward estimates period.
Revenue from general rates is forecast to increase by 7.9 per cent in 2021-22 and at a compounding average of 6.9 per cent per annum over the forward estimates period. Conveyance duty – a tax that is allegedly being abolished and replaced by general rates – will increase by a staggering 42.6 per cent in 2021-22, providing an additional $105 million.
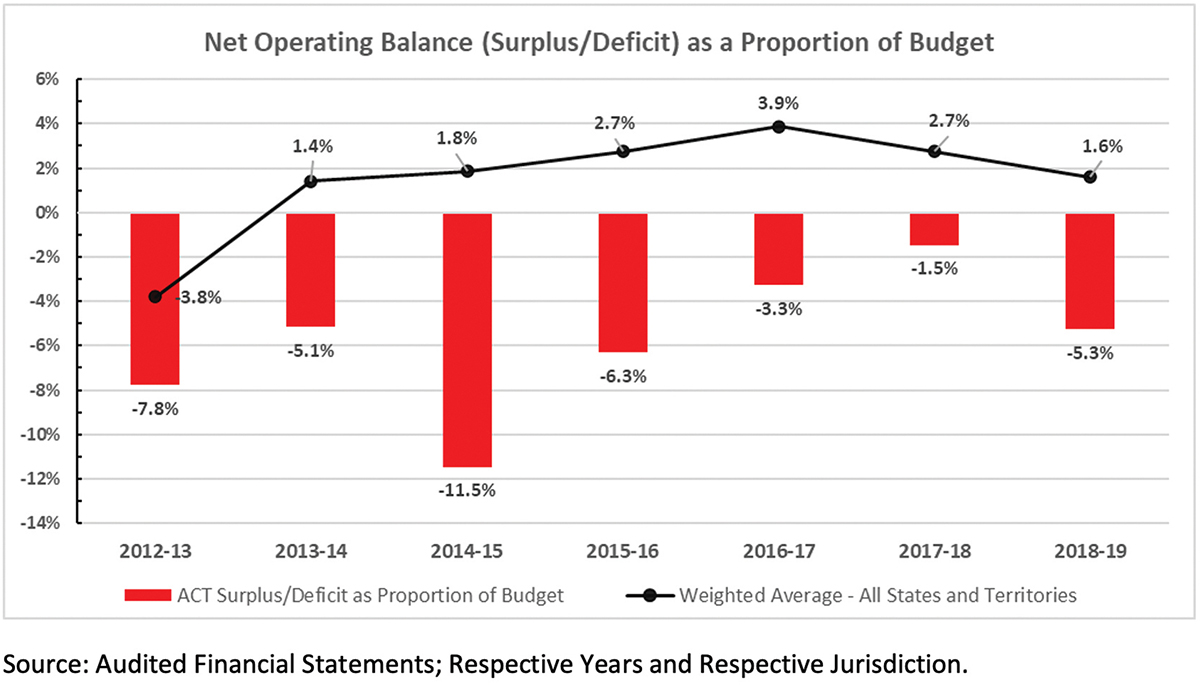 CHART 3
While others grow, 13 deficits in a row
IT is interesting to compare the Budget trends and positions of States and Territories in the years leading up to the pandemic.
The comparison presented in CHART 3 reveals that since 2013-14 the states and territories collectively have remained in modest to strong surplus.
However, the ACT stands out as persistently in deficit, at an average of 5.5 per cent per annum. During this period, while the ACT government has repeatedly forecast a return to a balanced or surplus Budget, it has never done so.
Notably, by the end of the current forward estimates period, the ACT government will have produced 13 uninterrupted deficits.
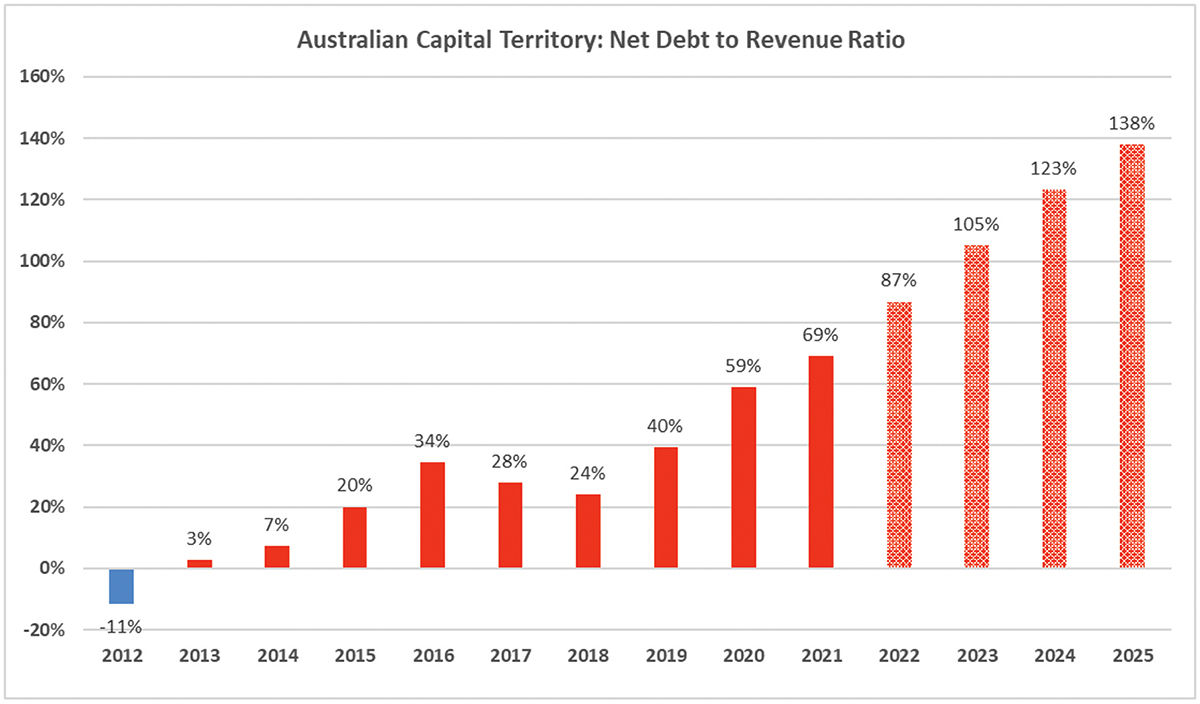 CHART 4
Debt will fall on the kids to come
THE inadequacy of the government’s response to the economic consequences of covid and its precarious financial position over the forward estimates is a direct consequence of the structural deficit that persisted for around seven years before the pandemic.
This is a period during which, as regularly attested to by the government, the ACT economy was performing well.
Not surprisingly, the ACT’s net debt has also increased significantly over this period (CHART 4). An appropriate comparator of state/territory government indebtedness is their net debt-to-revenue ratio.
For the ACT, the net debt-to-revenue ratio increased from a negative position of -11 per cent in 2012 (which means that its cash holdings in that year exceeded its debt) to 69 per cent in 2021 and is forecast to increase to 138 per cent of its revenue in 2025.
The debt will, of course, ultimately need to be paid, and future revenues will need to increase significantly over and above the amount required to maintain services. This burden will inevitably fall on future generations of Canberrans.
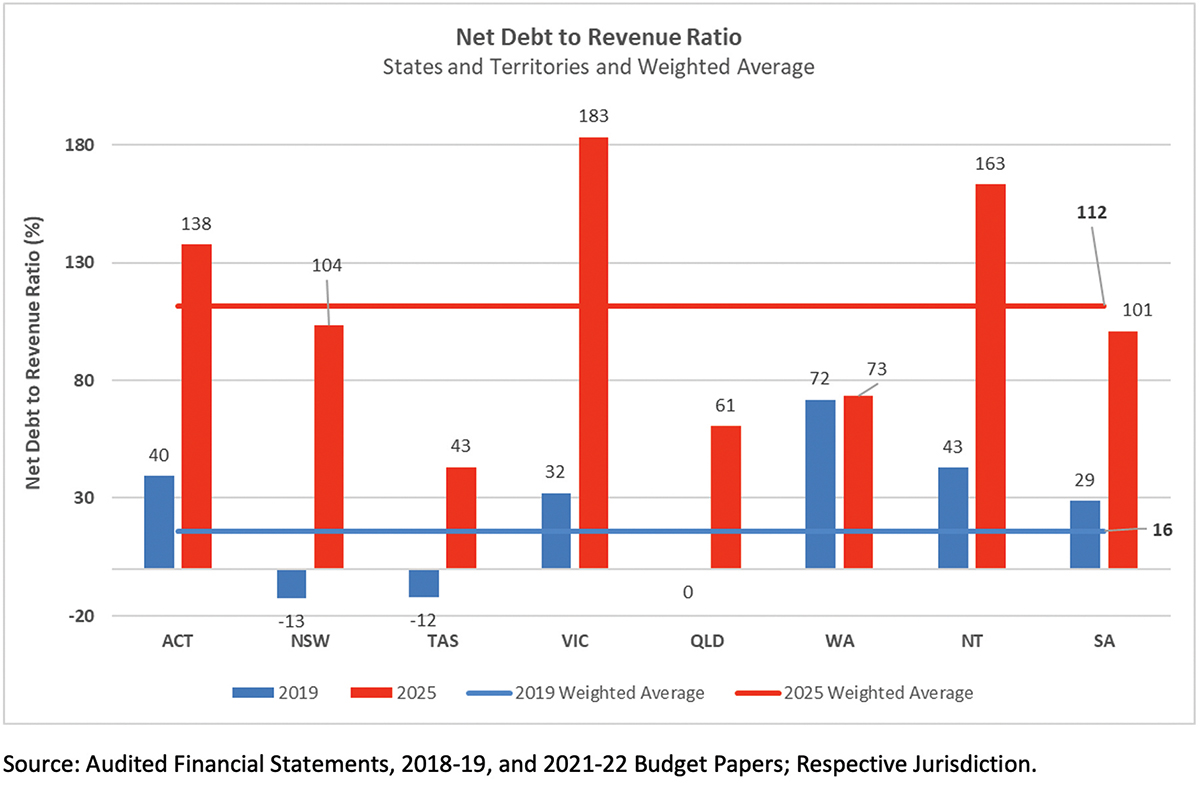 CHART 5
Limited capacity to sustain high debt
IT is true that all jurisdictions carry a level of debt, which will have increased due to the impacts of the pandemic.
It is useful, nevertheless, to compare the position and changes in all other states and territories’ debt before and after the pandemic (CHART 5).
In 2019, ie, before the pandemic, the weighted average of net-debt-to-revenue ratio across all jurisdictions was 16 per cent. NSW, Tasmania and Queensland were in a negative net-debt position, while the ACT’s net-debt-to-revenue ratio had increased to 40 per cent due to its persistent deficits in previous years.
Based on the Budget forecasts of all jurisdictions, the average net-debt ratio will increase to 112 per cent of revenue by the end of the current forward estimates. The ACT’s net debt is forecast to increase to 138 per cent of revenue, well above the national average.
Notably, the ACT’s net debt has increased despite the strong revenue growth, as discussed, and the lack of any significant increase in infrastructure investment in this Budget.
A limited capacity to sustain high debt levels further distinguishes the ACT from other jurisdictions. Victoria and the NT, which have forecast higher net debt than the ACT, have some surety in substantial manufacturing and mining bases respectively and, as such, are in a better position to sustain such high levels of debt.
Who can be trusted?
In a world of spin and confusion, there’s never been a more important time to support independent journalism in Canberra.
If you trust our work online and want to enforce the power of independent voices, I invite you to make a small contribution.
Every dollar of support is invested back into our journalism to help keep citynews.com.au strong and free.
Thank you,
Ian Meikle, editor


Leave a Reply